|
|
|
The author remains responsible for any bugs which exist in this software. This software is not officially supported by GAMS Corporation.
This is unsupported software developed for my own use which I am distributing freely to GAMS users. The motivation for this package is that computational work often involves calculations followed by plotting of results. Excel provides a quick and easy way to produce graphical images from a GAMS program. This program is relatively new, so I would be very pleased to receive a bug report or two. Of course, there are no warranties.
Copy the libinclude file into your GAMS INCLIB directory, typically c:\Program Files\gams\inclib. The XLCHART.GMS utility may alternatively be called using $batinclude if you do not wish to include it in the INCLIB directory.
In GAMS, an environment variable is set with a statement such as:
$set variable value
This passes a variable with a specified value to XLCHART. The following variables are understood:
| domain | Specifies the domain on the x-axis of data which are to be displayed. |
| series | Specifies the data series (individual output plots) which are to be displayed. |
| labels | Subset of X axis labels to be displayed on a chart. |
| batch | Switch specifies whether the graphical output is be displayed or only saved in the XLS file. |
| xlsfile | Specifies the name of the XLS file in which the data and charts are to be displayed. |
| charttype | Specifies the type of chart to be produced. When labels is not $set, the default format is 74 (xlXYScatterLines). When labels is $set, the default chart type is 4 (xlLine). Example 2 illlustrates how to produce a chart with type 51 (xlColumnClustered). |
$title Example 1: Plot a one dimensional vector
set t Time domain of the plot /1990*2030/,
tzero(t) Time periods with zeroes /2010*2014/,
decade(t) Time periods to be labelled /1990,2000,2010,2020,2030/;
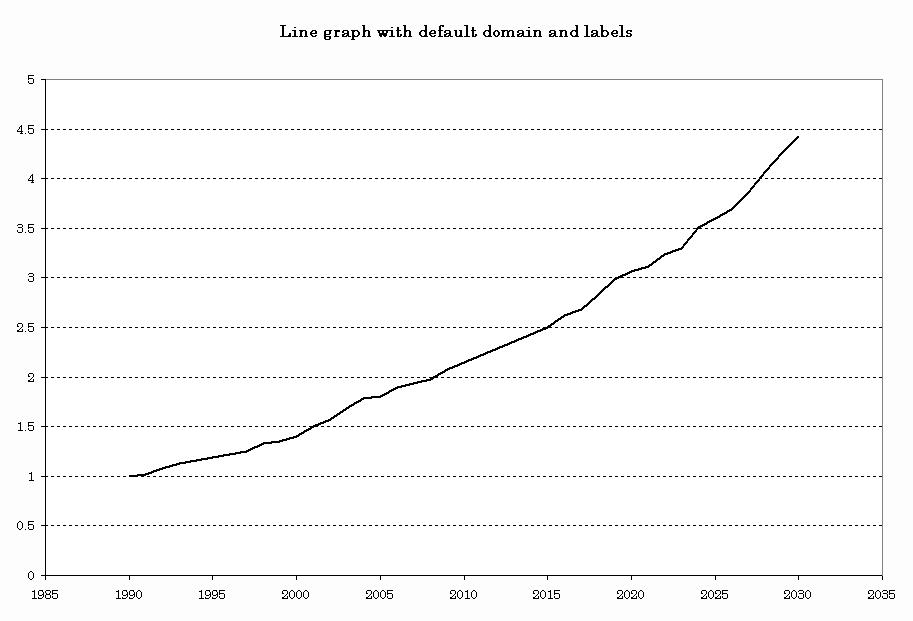
parameter a(t) Line graph with default domain and labels /
1990 1.000, 1991 1.019, 1992 1.082, 1993 1.129, 1994 1.160,
1995 1.191, 1996 1.217, 1997 1.254, 1998 1.333, 1999 1.349,
2000 1.403, 2001 1.504, 2002 1.572, 2003 1.684, 2004 1.780,
2005 1.809, 2006 1.898, 2007 1.932, 2008 1.979, 2009 2.079,
* Note that five years have zero value, and these values will not show up in the
* plot if the domain is not specified explicitly:
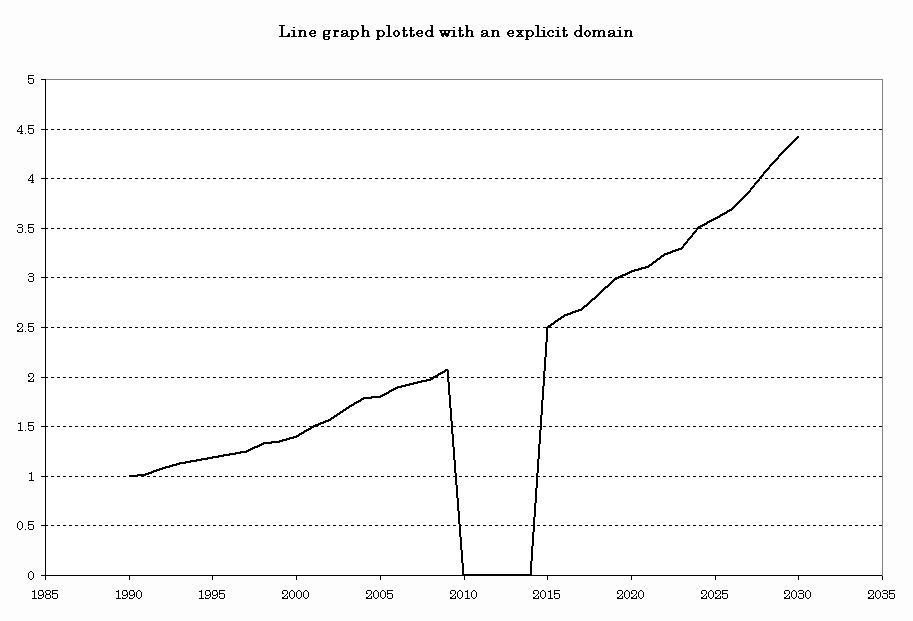
2010 0.000, 2011 0.000, 2012 0.000, 2013 0.000, 2014 0.000,
2015 2.500, 2016 2.626, 2017 2.686, 2018 2.822, 2019 2.985,
2020 3.067, 2021 3.113, 2022 3.238, 2023 3.297, 2024 3.507,
2025 3.595, 2026 3.689, 2027 3.859, 2028 4.069, 2029 4.265,
2030 4.425 /,
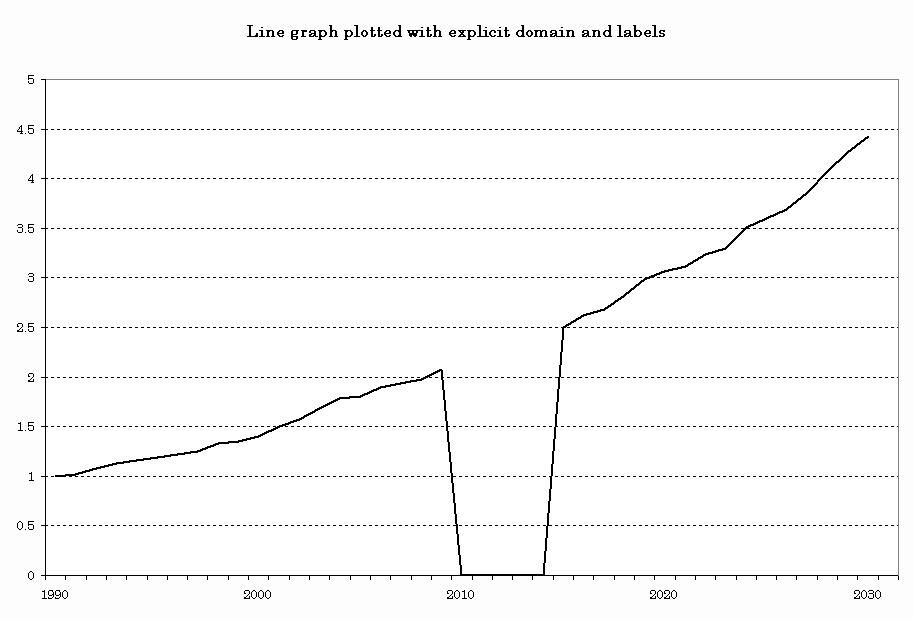
b(t) Line graph plotted with an explicit domain,
c(t) Line graph plotted with explicit domain and labels;
* I've included the data explicitly. Here is the GAMS code to generate the data:
* a("1990") = 1; loop(t, a(t+1) = a(t) * (1 + 0.04 * uniform(0.2,1.8)); ); a(tzero) = 0;
* Use the same data for all three arrays -- the arrays only differ
* in their descriptive text:
b(t) = a(t);
c(t) = a(t);
display a;
* I know that a() is defined over set t. The plotting package
* knows that the argument has one dimension, but it does not know
* what set defines those entry. Three ways to pass the domain:
* (i) Let GAMS figure out which elements of A are nonzero (this creates
* a problem because the years in which a(t)=0 are missed).
$libinclude xlchart a
*       (ii) Specify the domain explicitly so that the plot is properly drawn:

$set domain t
$libinclude xlchart b
*       (iii) Specify both the domain and the labels:

$set domain t
$set labels decade
$libinclude xlchart c
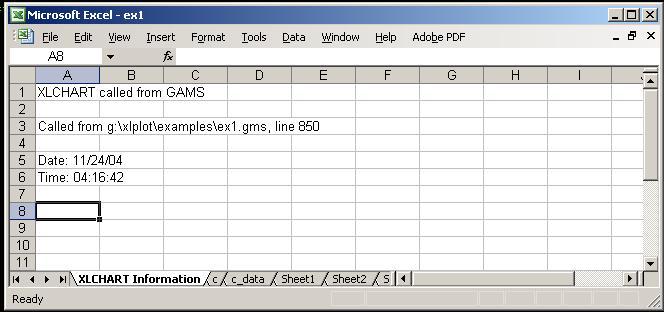
*	(iv) Generate a graph in batch mode and save it to a specific
*	XLS file:

$set batch
$set xlsfile ex1.xls
$libinclude xlchart c
Three worksheets are written to the ex1.xls workbook. The first is an information page indicating the date, time and GAMS program file from which the data was generated:
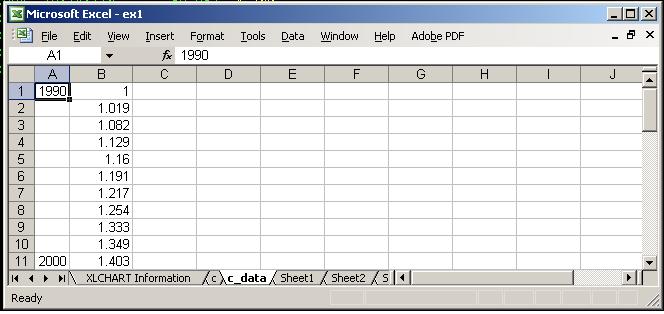
The second worksheet contains the chart, and the third contains the data for the chart:
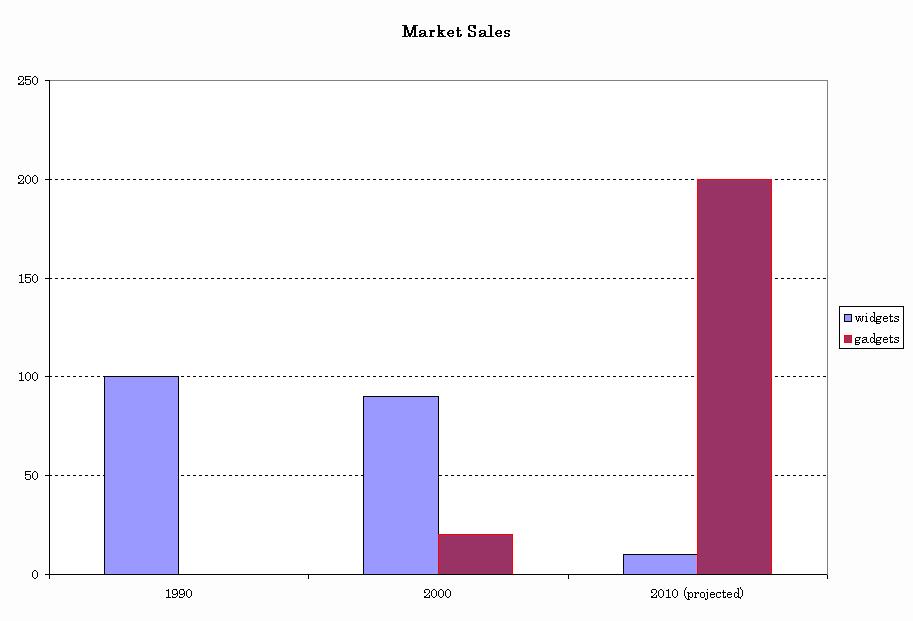
$title  Example 2: Plot a Histogram


set	t	Time periods /1990,2000,2010/
	l(t)	Labels	/1990,2000,2010  2010 (projected) /,
	p	Products /widgets, gadgets/


table	sales(t,p)	Market Sales

	widgets		gadgets
1990	100		0
2000	90		20
2010	10		200;

*	Specify domain, labels and series all explicitly:

$set domain t
$set labels l
$set series p

*	Request a clustered column chart:

$set charttype 51

$libinclude xlchart sales
The output generated by ex2.gms :
ex3.gms
VBScript code for customizing charts can be provided through
an options file, XLCHART.OPT. The GAMS
$onecho/$offecho syntax
provides a convenient way to write this file.
Excel itself provides the best "documentation" for the use of VBScript to automate. If you want to automate some aspect of a chart, you should first load a generic version of the chart in Excel, then select /Tools /Macro /Record. This will record your subsequent actions as a VBA macro. After you have completed the changes you want to make to the chart, then hit the button on the floating "macro recording box" to complete the macro.
After having recorded the macro, then enter /Tools /Macro /Macros /Edit. The Visual Basic editor then opens a file containing the VBA script you just recorded. You can use this script to discover the commands which perform a particular task on the chart object.
One annoyance is that you will need to translate all of the Excel constants before writing the instructions here. In the editor, if you highlight a constant, such as "xlSolid", and then enter shift-F2, you will see the integer value to which the constant refers.
When you translate a set of chart edits to the options file, use the symbol c to refer to the active chart object and use p to refer to the name of the parameter being plotted (a string).
When you use the $ONECHO statement, GAMS performs string substitutions as the file is echoed, so %gams.workdir% is substitued by the explicit path to the working directory.
$title  Example 3: Accessing Chart Properties through XLCHART.OPT

set t /1990*2030/, j /a,b,c,d/;

parameter a(t,j)  A Typical Time-Series Plot;
a("1990",j) = 1;
loop(t,  a(t+1,j) = a(t,j) * (1 + 0.04 * uniform(0.2,1.8)); );

$onecho >xlchart.opt

'	Choose a nice background color

  c.PlotArea.Interior.Color = RGB(255,255,220)
  c.PlotArea.Interior.Pattern = 1 'XlSolid

'	Revise the chart title:

  c.HasTitle = True
  c.ChartTitle.Characters.Text = "Projected Values"

'	Add a label for the X axis:

  c.Axes(1, 1).HasTitle = True ' xlCategory=1, xlPrimary=1
  c.Axes(1, 1).AxisTitle.Characters.Text = "Year"

'	Add a label for the Y axis:

  c.Axes(2, 1).HasTitle = True 'xlValue=2, xlPrimary=1
  c.Axes(2, 1).AxisTitle.Characters.Text = "Index Value (1990=1)"

'	Insert major grid lines on the X axis:

  c.Axes(1).HasMajorGridlines = True 'xlCategory=1
  c.Axes(1).HasMinorGridlines = False

'	Insert major grid lines on the Y axis:

  c.Axes(2).HasMajorGridlines = True 'xlValue=2
  c.Axes(2).HasMinorGridlines = False

'	Put the legend at the bottom of the chart:


  c.HasLegend = True
  c.Legend.Position = -4107 'xlBottom

'	Choose a font for the graph:

  c.ChartArea.Font.Name = "Times New Roman"
  c.ChartArea.Font.Size = 10
  c.ChartArea.FontStyle = "Regular"

'	Title is bold, 14 point:

  c.ChartTitle.Font.FontStyle = "Bold"
  c.ChartTitle.Font.Size = 14

'	Product a graphics file with the graph in either GIF or JPG
'	formats:

  c.export "%gams.workdir%"&p&".gif","GIF"
  c.export "%gams.workdir%"&p&".jpg","JPG"

$offecho

$set domain t
$set series j

$libinclude xlchart a
The GIF file generated by ex3.gms is named a.gif:
$title Example 4: Multiple Charts with Custom Formatting
set t /1990*2030/, j /a,b,c,d/;
parameter c1(t,j) Chart 1 A Yellow Chart
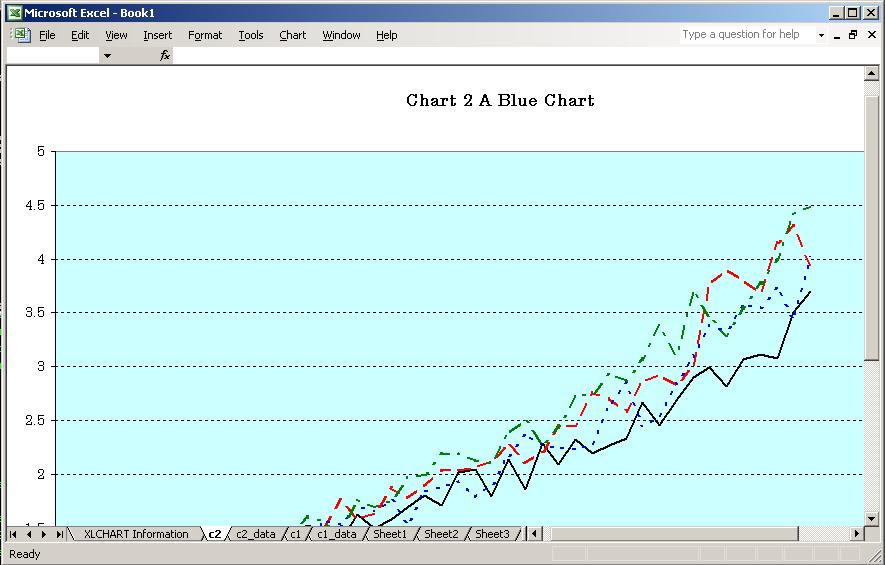
c2(t,j) Chart 2 A Blue Chart ;
* Some data comes from GAMS:
c1("1990",j) = 1;
loop(t, c1(t+1,j) = c1(t,j) * (1 + 0.04 * uniform(0.2,1.8)); );
c2(t,j) = uniform(0.9,1.1) * c1(t,j);
* Define options for the two graphs separately by writing
* VBScript which conditions on p, the name of the parameter
* being plotted:
$onecho >xlchart.opt
' Place the legend at the bottom of both charts:
c.HasLegend = True
c.Legend.Position = -4107 'xlBottom
' Select an different color for each chart:
if p="c1" then
c.PlotArea.Interior.Color = RGB(255,255,220)
c.PlotArea.Interior.Pattern = 1 'XlSolid
end if
if p="c2" then
c.PlotArea.Interior.Color = RGB(200,255,255)
c.PlotArea.Interior.Pattern = 1 'XlSolid"
end if
$offecho
* Produce a workbook with both charts:
$libinclude xlchart c1 c2
The workbook generated by ex4.gms contains both c1 and c2:
$title Example 5: Dealing with Zero Rows and Zero Columns
set i evaluation points /1990*2000/
j various time seris /a, b, c, d/;
$set labels i
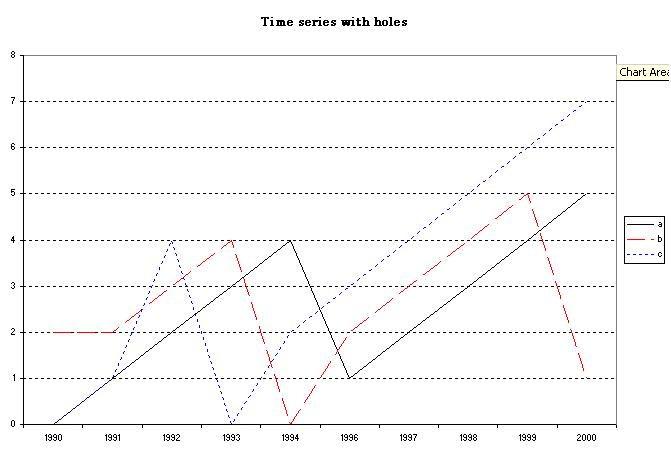
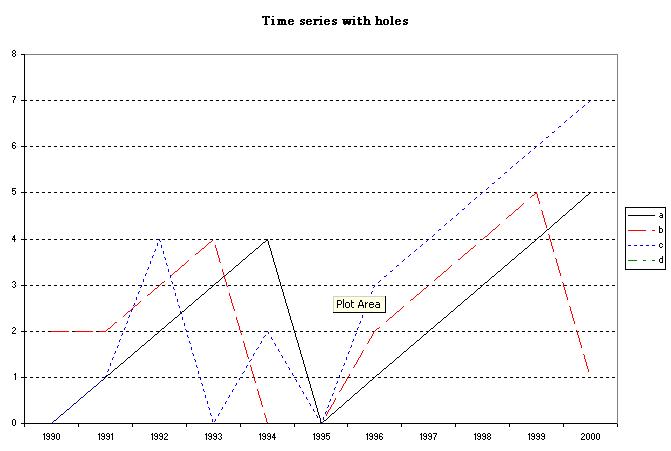
table time_path(i,j) Time series with holes
a b c d
1990 0 2 0 0
1991 1 2 1 0
1992 2 3 4 0
1993 3 4 0 0
1994 4 0 2 0
1995 0 0 0 0
1996 1 2 3 0
1997 2 3 4 0
1998 3 4 5 0
1999 4 5 6 0
2000 5 1 7 0;
* Note that time series d is all zeros, and
* all of the time series equals zero in 1995.
$libinclude xlchart time_path
* Method 1: Define an explicit domain and series:
$set domain i
$set series j
$libinclude xlchart time_path
* Method 2: omit the domain and series, and
* replace zero by eps. This will assure that GAMS
* puts zeros onto the CSV file:
$set domain
$set series
time_path(i,j)$(time_path(i,j)=0) = eps;
$libinclude xlchart time_path
The first plot which fails to capture the missint value appears as
follows: